
Ask a marketing team how the last reactivation campaign performed, and you will get a redemption rate within seconds. Ask how many of those customers would have returned without the coupon, and the answer takes considerably longer.
That second number is critical to knowing whether the programme created incremental value or simply recorded purchases that would have happened anyway. Redemption tells you who used the code. Incrementality tells you what the campaign actually added.
The distinction is well established in analytics, but it rarely survives contact with a campaign calendar. A serious customer win-back strategy has to get three things right in order. When you decide a customer has lapsed, who you approach, and what you put in front of them.
Most win-back programmes run on a single lapse window. Somebody chose ninety days, or sixty, or a hundred and eighty, and that number now governs the programme. It decides who enters the list, who receives an offer, and who the business silently treats as gone.
The difficulty is that one window applies the same standard to everyone. A shopper who reorders every three weeks and a shopper who reorders twice a year will both cross day ninety, but only one of them has changed behaviour in any meaningful way.
A better measure is drift. Every customer has a natural purchase interval, and what matters is how far past their own rhythm they have travelled. A customer who normally reorders monthly and has now been quiet for three months has genuinely changed behaviour. A customer five weeks into a monthly cycle almost certainly has not, even though a fixed window may already have flagged them. Calculating that interval per customer and measuring deviation against it can make your lapsed customer targeting more precise.
This one change can materially reshape the eligible list before you test a single creative variation.
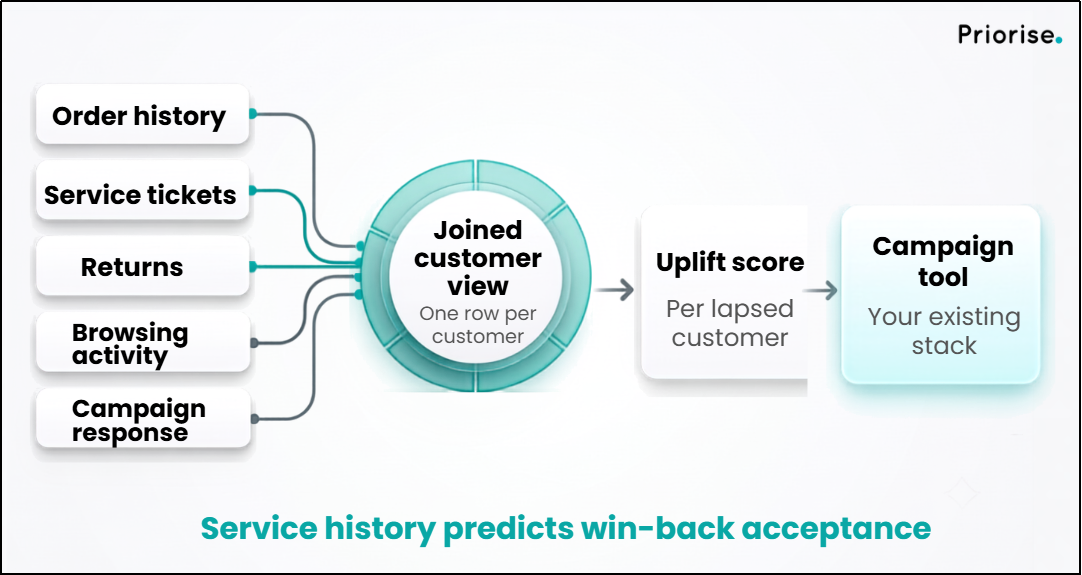
FIg 1: Lapsed customer targeting starts by joining order, service, returns, browsing and campaign data into one record per customer
This is where reactivation budgets usually leak.
A response model predicts who is likely to buy. A win-back model should estimate who is more likely to buy because you contacted them. Those are different questions, and they produce different lists. A high purchase propensity does not mean a customer will buy because you reached out. Sending a discount on propensity alone transfers margin to people who were coming back anyway.
Analysts call this uplift modelling. The method compares a treated group against a control group and ranks customers by the difference between them rather than by raw probability.
There is a second consideration that carries real cost. Much of the uplift work in circulation optimises for incremental conversions, which only holds up while customers spend similar amounts. Once spend varies across your base, maximising incremental conversions and maximising incremental profit stop being the same objective. The customer worth targeting had no intention of buying, responds to the offer, and then places a large order. That is a revenue uplift objective rather than a conversion one, and it is worth confirming which of the two your current scoring optimises.
The distinction can be framed such that:
Response: Who is likely to buy?
Uplift: Who is likely to buy because of the campaign?
Revenue uplift: Who is likely to generate the most additional revenue because of it?
Profit uplift: Who is likely to generate the most additional profit after the cost of the intervention?
That progression matters because the best conversion target is not automatically the best commercial target. Once scores exist, the lapsed base separates into four groups that warrant different treatment.
| Group | What the data shows | Recommended treatment | Cost of getting it wrong |
|---|---|---|---|
| Persuadable | Clear drift from their own cadence; some engagement signal remains | Direct budget here. Use a relevant offer with a reason attached | Missed incremental value |
| Sure thing | Likely to return regardless, often still within their normal cycle | Use a reminder or restock message. Withhold the discount | Margin given away without incremental gain |
| Lost cause | Long gone, potentially replaced you, little engagement signal | Minimal contact, perhaps one low-cost channel test | Wasted contacts and weaker sender reputation |
| Do not disturb | Negative uplift. Contact appears to reduce purchase likelihood | No contact | Unsubscribes, complaints, and lost future reach |
Rules-based segmentation cannot separate these groups, because rules only see elapsed days. Predictive win-back scoring reads cadence drift, category mix, discount sensitivity, returns, service tickets, browsing activity during the quiet period, tenure, and seasonality.
Some of the strongest signals may sit in the first relationship rather than in the silence that followed. Referral history, complaint resolution, and service interactions can add context that recency alone misses. Joining that information to campaign data can give the model a clearer view of why a customer disengaged and whether another contact is likely to help.
Campaign profit in a win-back programme is straightforward to state. Take the revenue from the treated group, subtract the revenue the control group produced anyway, then subtract contact costs and the cost of the incentive.
That final component is the one teams underestimate. A 10% discount is not a flat cost per customer. It scales with basket size, which makes your highest-value customers redeeming your deepest offer both the strongest headline result and the most expensive one.
The reason someone left should shape what you send them. A customer who left after a service failure may need a fix or acknowledgement rather than a discount. A price-sensitive customer may require a different reacquisition approach, particularly if the underlying economics make repeated discounting unprofitable. The sequence matters too. Discount to reopen the relationship, then stop. Many programmes do the reverse and keep issuing the same code to the same returned customer indefinitely, which is how a win-back offer slowly becomes a standing discount.
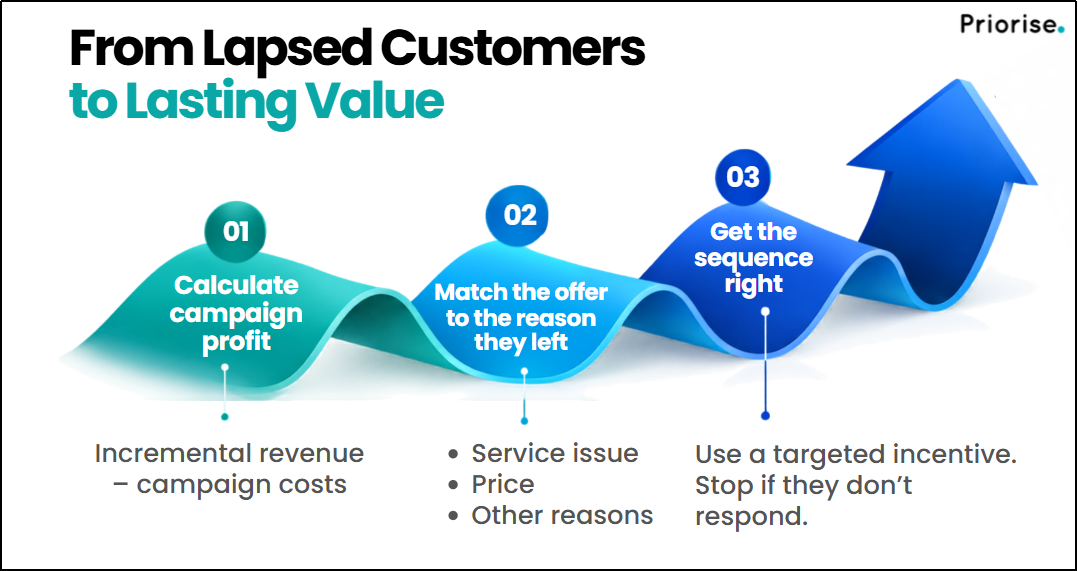
Fig 2: Incremental win-back ROI is what survives after the control group, the contact cost and the discount come out [Priorise]
That points towards an escalation ladder rather than a single offer:
A deeper discount can lift short-term response. It can also teach the base to wait for the code, with the cost surfacing two or three quarters later. The strongest programmes treat the incentive as a cost to be justified rather than a lever for raising redemption.
The cleanest way to measure incrementality is to withhold contact from a randomly selected control group. That creates the counterfactual you need to estimate how many customers returned because of the campaign rather than on their own.
Randomly hold out a portion of the eligible base and define in advance how that control group will be maintained across the campaign. Then track cost per incremental returned customer alongside incremental revenue and profit. Response rate will flatter the programme. Attributed revenue will flatter it further. Incremental win-back ROI will not.
Research on revenue uplift modelling across European e-commerce followed a live e-couponing campaign at a books and toys retailer that was returning €8.34 of incremental profit per customer. Targeting only the highest-scoring 10% with a revenue uplift model raised that to €18.89 per targeted customer, a 126.5% improvement, with the cost of the discount already deducted.
One finding from that work deserves more attention than it gets. Targeting the entire base produced the same result as random targeting. All of the value the model created came from the customers it excluded. A win-back model is not a list builder. It is an exclusion engine.
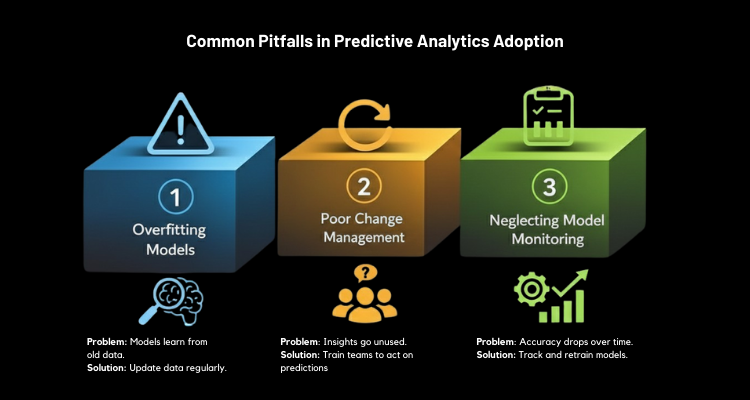
Fig 3: Diagram showing a common failure mode [Priorise]
Win-back projects often open with a debate about which causal machine learning method to adopt. That debate is usually premature.
In the same research, a simple response transformation beat far heavier causal methods across most of the data and ran in seconds rather than minutes. Two-stage models built for the fact that most of a lapsed list never buys failed to improve results in three of four cases.
Sophistication is not necessarily the constraint. Campaign data can contain a relatively weak signal, so the first gains often come from cleaner definitions and more honest measurement rather than immediately adopting a more sophisticated algorithm.
For a customer reactivation campaign that has plateaued, we would work in this sequence. Define lapse at customer level rather than company level. Establish the holdout before the next send. Join service and returns history to the campaign table, because that is where the defection reason lives. Score the base by incremental return likelihood rather than raw propensity, direct budget towards the middle of that list, and hold the discount back from the top.
The practical problem often starts with the data layer rather than the modelling. Order history sits in one system, service tickets in another, and campaign response in a third, making it difficult to create a consistent customer-level view.
That is where Priorise differentiates. It builds the joined customer view, scores the lapsed base through the Insight Engine, and pushes those scores into the tools your team already uses to run campaigns.
The value is in the customers you do not contact.

You might also like: Using AI and Machine Learning for Customer Retention Analytics
——————————————————————————
Sources
8 The Green Ste A,
Dover, DE – 19901
103-105, 1st Floor, Krishna Square, Subhash Nagar, Jaipur – 302016
+91 7300266999