


Power BI vs Tableau, and Looker each suit different business needs in 2026. Power BI offers the best value and seamless Microsoft integration, making it ideal for small to mid-sized businesses already using Excel or Azure. Tableau excels at advanced, highly customizable data visualizations, favored by data analysts handling complex datasets. Looker, built on Google Cloud, is best for enterprises needing centralized, governed data modeling via LookML and real-time cloud analytics integration.
Data is piling up faster than most teams can use it. Every sale, click, and ticket leaves a trail, and the hard part was never collecting it; it’s turning that data into a decision someone can act on in time.
Picture a mid-sized retailer where Monday mornings start the same way: sales numbers in one system, customer records in another, finance in a third. Managers spend the first two hours reconciling spreadsheets instead of reviewing strategy. This is the bottleneck that pushes companies to finally settle the Power BI vs Tableau vs Looker question, no longer a task for IT alone, but one that shapes how fast a business moves and how well it grows.
This guide covers pricing, usability, scalability, and business value so you can decide which platform fits your team.
Why Business Intelligence Matters More Than Ever
Nobody wants to wait for answers anymore. Teams expect dashboards that update themselves, not reports that trickle in days late. Marketing wants same-day campaign numbers; finance wants forecasts it can trust; operations wants inventory shifts in real time.
A solid analytics setup helps a company:
- Make decisions faster
- Cut reporting mistakes
- Run leaner operations
- See revenue trends clearly
- Lean into AI-supported decisions
Power BI vs Tableau vs Looker: A Feature Comparison
Among the leading business intelligence tools on the market, these three dominate most shortlists. Power BI holds around 30% of the global BI market, per Acuity Training, while Tableau sits at roughly 18%, per 6 sense.
| Feature | Power BI | Tableau | Looker |
|---|---|---|---|
| Ease of Use | Excellent | Very Good | Moderate |
| Pricing | Affordable | Premium | Enterprise |
| Cloud Integration | Excellent | Excellent | Excellent |
| Microsoft Ecosystem | Best | Limited | Limited |
| Google Cloud Integration | Good | Good | Excellent |
| Dashboard Design | Very Good | Excellent | Good |
| Self-service BI | Excellent | Excellent | Moderate |
| Enterprise Scalability | Excellent | Excellent | Excellent |
| Price | ~$10/user/month | ~$15-$75/user/month | Custom-quoted |
| AI Features | Strong (Copilot, plus agentic capabilities via Microsoft Fabric) | Strong (Tableau Pulse and Tableau Next, built on Salesforce’s Einstein/Agentforce layer) | Strong (Gemini in Looker, grounded in the LookML semantic layer) |
| Analyst Recognition | Leader, Gartner Magic Quadrant for Analytics and BI Platforms; Leader, Forrester Wave for BI Platforms | Leader, Gartner Magic Quadrant for Analytics and BI Platforms; Leader, Forrester Wave for BI Platforms | Leader, Gartner Magic Quadrant for Analytics and BI Platforms |
Which Platform Handles Self-Service Better?
Most companies would rather have employees answer their own questions than wait on IT. That’s the main purpose of self-service BI and a key part of the Power BI vs Tableau conversation.
Power BI leans on its Excel-like feel, so report building doesn’t feel foreign. Tableau lets people explore data by dragging and dropping. Looker takes a more locked-down approach, favouring governed, consistent metrics though Gemini’s conversational layer is starting to soften that for casual users.
Between the three, Power BI vs Tableau tends to come out ahead for organizations that want to hand data access to more people without losing control. Self-service reporting alone saves the average Power BI user over 125 hours a year, according to Acuity Training time that goes back into analysis instead of running the same export every Friday.
Self-Service Analytics: Getting Every Team Involved
Analytics doesn’t need to stay locked inside a data team anymore. Finance can watch its own budget, marketing can track campaigns, HR can follow workforce trends, and sales can check the pipeline, without submitting a ticket.
Power BI does this well through its Microsoft ties. Tableau goes deeper for those who want to dig into the data themselves. Looker keeps things consistent across departments through shared, governed metrics. The right fit depends on the skills your team already has.
Comparing the Visualization Side
Good visuals do the heavy lifting of turning numbers into something a person understands at a glance. Power BI is strong for executive dashboards, KPI tracking, and interactive charts. Tableau pulls ahead on storytelling – geographic mapping, layered dashboards, and exploration that rewards a skilled analyst. Its 2026 push, though, is less about new chart types and more about Tableau Pulse pushing insights to people who never open a workbook at all. Looker focuses more narrowly on embedded reporting and consistent metrics across a cloud stack.
Among today’s data visualization tools, Tableau holds the edge for creative, exploratory work, while Power BI usually wins on cost versus value. Governance needs, integration, and licensing budgets all factor in too.
A few practical filters can help you narrow things down quickly:
- Budget: Already on Microsoft licenses? Power BI’s entry cost is exceptionally competitive to beat, a key reason the Power BI vs Tableau debate keeps coming back to price.
- Team skill level: Power BI suits teams without a dedicated analyst. Tableau rewards people who know how to build sophisticated visuals.
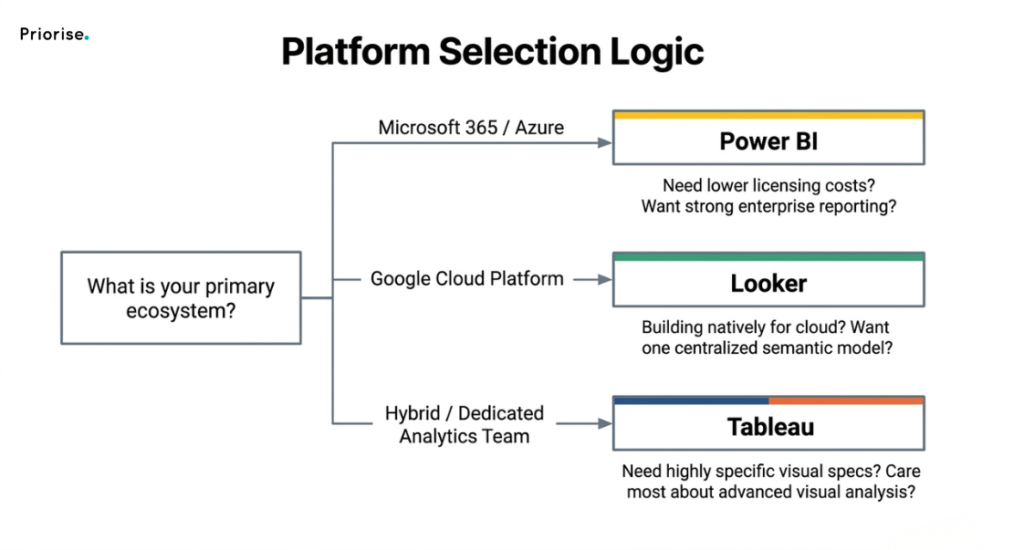
- Existing stack: Looker makes sense on Google Cloud. A Microsoft-heavy environment points back to Power BI.
- Speed to value: Power BI and Tableau both tend to get teams running faster than Looker.
So, What’s the Best BI Tool for Your Business?
There’s no single best BI tool for every company, the right pick depends on what your business actually needs.
Power BI fits well if you:
Already run on Microsoft 365 Want lower licensing costs Need strong enterprise reporting Are ready to adopt Microsoft Fabric as your broader data platform.
Tableau fits well if you:
Care most about advanced visual analysis Have analysts who know their way around data Need dashboards built to a very specific spec Want Salesforce-native, proactive metric alerts through Tableau Pulse.
Looker fits well if you:
Run primarily on Google Cloud Want one centralized semantic model Are building analytics natively for the cloud Want conversational, natural-language querying via Gemini without giving up governance.
For smaller and mid-sized companies, Power BI usually wins on cost and simplicity. Larger enterprises with dedicated analytics teams often lean toward Tableau. Whichever way the Power BI vs Tableau decision lands, the right choice matches your existing tools and your people’s skills, not just the flashiest demo.
Where Outside Expertise Comes In
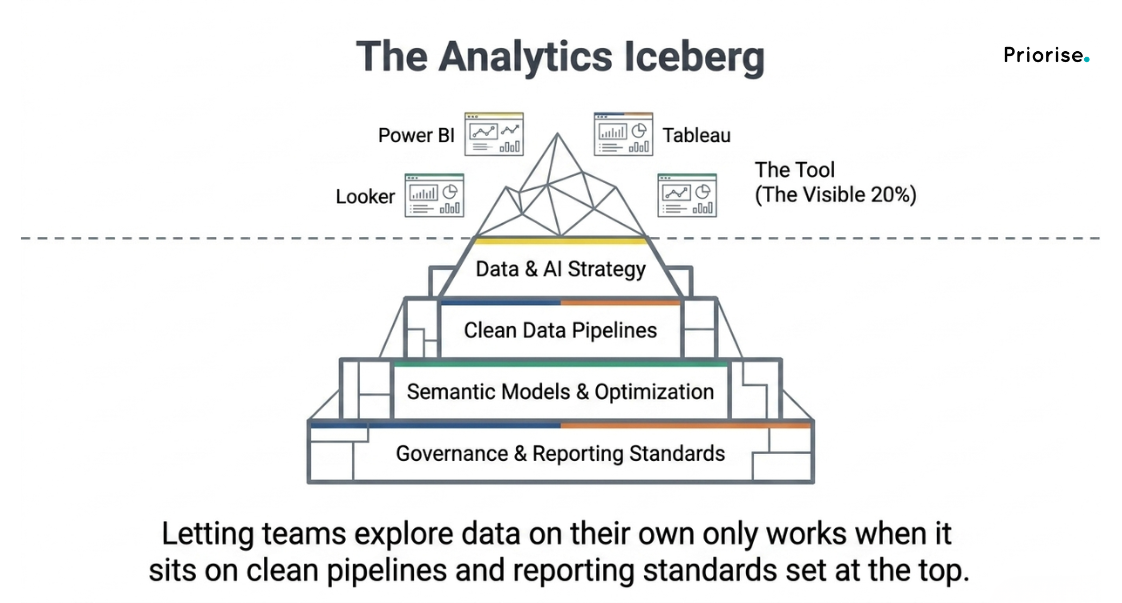
Buying the software is the easy part. Plenty of companies struggle with messy data, contradictory reports, or dashboards nobody opens. That’s where good business intelligence services pay off, building a data strategy, designing dashboards people use, and setting up governance.
That same thinking applies to broader analytics work. Companies rely on data analytics services to clean up messy datasets, build models that forecast rather than just report, and automate work that used to eat entire afternoons.
None of this holds together without a plan, something closer to a full data & AI strategy than a single tool purchase. That means governance rules, cloud architecture that can grow, and reporting standards everyone follows.
For teams on Microsoft’s platform, working with a partner for Power BI consulting can shortcut a lot of trial and error, help build sound data models, speed up reports, establish real governance, and ensure users know how to use what they’ve been given.
Final Verdict: Which BI Tool Should You Choose?
The Power BI vs Tableau vs Looker debate isn’t going away soon; all three keep evolving in a fast-growing market. Global BI spend was valued at roughly $35.3 billion in 2025, growing at a 9.35% annual rate through 2034, per Polaris Market Research. If affordability and Microsoft ties matter most, Power BI is hard to beat, already used by close to 97% of Fortune 500 companies, per Acuity Training. If highly customized visuals are the priority, Tableau still leads. And if your infrastructure lives on Google Cloud, Looker is worth serious consideration.
All three remain Leaders in the Gartner Magic Quadrant for Analytics and Business Intelligence Platforms, and analyst reports like the Forrester Wave for BI Platforms echo that ranking, a useful sanity check for any shortlist, but not a substitute for testing a tool against your own data and workflows.
Priorise helps companies get past the dashboard stage and become genuinely data-driven, turning the right platform choice into measurable growth.
FAQS
Which is easier for beginners, Power BI or Tableau?
Power BI usually wins, especially for teams comfortable with Excel. Tableau takes longer to learn but rewards the effort with more advanced visuals.
Is Looker worth it if we're not on Google Cloud?
Not really. Its biggest advantages a centralized model and governed access, shine on Google Cloud. Power BI or Tableau usually serves teams on Azure or hybrid setups better.
Can we switch platforms later without having to rebuild everything?
Technically yes, but rarely simply. Dashboards and governance rules often need rebuilding, which is why companies get outside help early to avoid a costly redo.
What's the difference between Tableau Pulse and Tableau Next?
Tableau Pulse is the proactive metrics feature, it pushes plain-language summaries and anomaly alerts to users. Tableau Next is the broader agentic analytics platform it sits within, built on Salesforce's Agentforce architecture, aimed at embedding governed insights directly into business workflows rather than a standalone dashboard.
Is Gemini in Looker the same as Power BI Copilot?
They solve a similar problem from natural-language access to data, but ground their answers differently. Copilot works against a Power BI semantic model; Gemini in Looker is grounded in the LookML semantic layer, which is part of why Google emphasizes it for governed, enterprise self-service.