



Key highlights
- Most loyalty analytics platform demos run on clean sample data. The useful questions test how the tool handles your data, not theirs.
- Identity resolution and data grain set the limits on what the platform can tell you. Ask about both before you look at a dashboard.
- A platform that cannot support a properly designed holdout or control group may report member behaviour as program impact.
A loyalty analytics platform demo usually looks good. The vendor loads a tidy dataset, the segments separate cleanly, and the churn scores rank in a neat curve. None of that shows how the tool will behave with your duplicates, your store systems, or your finance team’s definition of an active member.
The real test is whether the platform can work with your data, measure what actually changed, and turn those findings into action. The questions below focus on the work after the contract, where loyalty analytics software earns its fee or stalls.
Can the Platform Recognise One Member Across Every Channel?
Identity comes first because every other output depends on it. A member who shops in store with a phone number, online with an email, and in the app with a device ID looks like three light customers until the platform stitches them together. Split identities can push your best members into the wrong tier and inflate your lapsed count.
Ask how the platform matches records, how it resolves conflicts, and whether you can see and override the match rules. Matching on a login or phone number is easy. The harder test is a household where two adults share one card. Also ask what happens when a customer changes their email address, phone number, or other identifier. The vendor’s answer shows quickly whether its identity model can handle the messiness of real customer data.
What Grain Does the Data Arrive at?
Some platforms ingest line-level transactions. Others work with basket-level records or daily and weekly totals per member. Summaries load faster and cost less to run, but they can cap your analysis. You cannot study basket mix, category migration, or the effect of a points multiplier on one range if the platform only sees total spend.
Ask for the lowest grain the platform stores, how much history it keeps, and what happens to that history when you change a product hierarchy. Category remapping is routine in retail. If a platform automatically restates historical data without preserving the previous structure, year-on-year comparisons can become difficult to interpret.
Companies often underestimate how long it takes to check a new data foundation for accuracy. McKinsey1 has identified limited analytical and technical capability as one of the challenges companies face when trying to scale personalisation. Ask who owns data-quality checks, how long they took on the vendor’s last comparable build, and whether the quote includes that work.
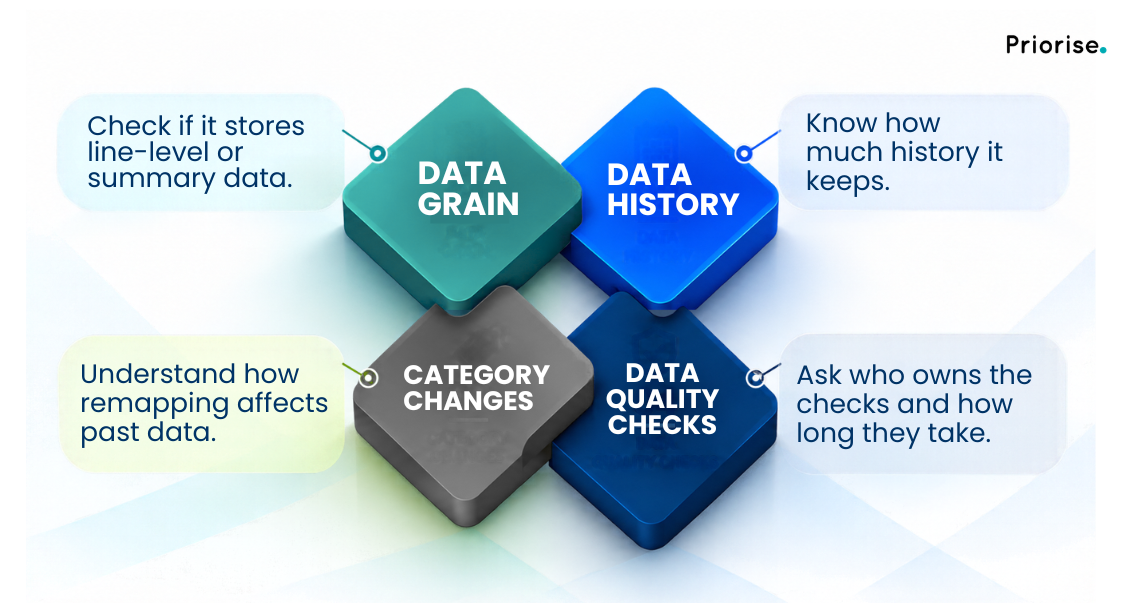
Fig 1: Choose a loyalty analytics platform that gives you the data depth needed for smarter decisions
How Does It Separate Program Impact From Member Behaviour?
Members often spend more than non-members. Much of that gap can reflect who chooses to join rather than what the program changes. A platform that relies on member-versus-non-member comparisons, or simple before-and-after comparisons around sign-up, can therefore overstate program impact.
A properly designed holdout or control group helps separate incremental impact from what would have happened anyway. This is also where the upside of customer loyalty analytics shows up. McKinsey reports that some companies testing personalised offers against standard mass offers have seen gross-margin improvements of two to four percentage points. You only get a meaningful result like that when the measurement design can distinguish incremental impact from ordinary member behaviour.
Ask how the platform sets up holdouts, how it protects them when a head-office campaign overrides local offers, and how it validates any lookalike matching. The same test applies to loyalty program analytics; can the platform measure incremental value, or is it mainly reporting what members did?
Where Do the Scores Go Once the Model Runs?
Churn propensity, next-best-offer, and tier-risk scores only pay back when they reach the systems that act on them, i.e., the offer engine, the POS, the CRM, and the app. Ask which of these the platform writes to directly, how often it updates them, and whether it captures what happened after the recommendation was used.
A nightly batch works for a monthly statement. It fails for a real-time offer at the till. More importantly, a platform that sends a recommendation but never captures the customer’s response makes it harder to learn which actions actually worked.
Then ask whether the platform knows what an offer costs. A model that recommends double points without seeing the points liability or the category margin will optimise for response rather than profit.
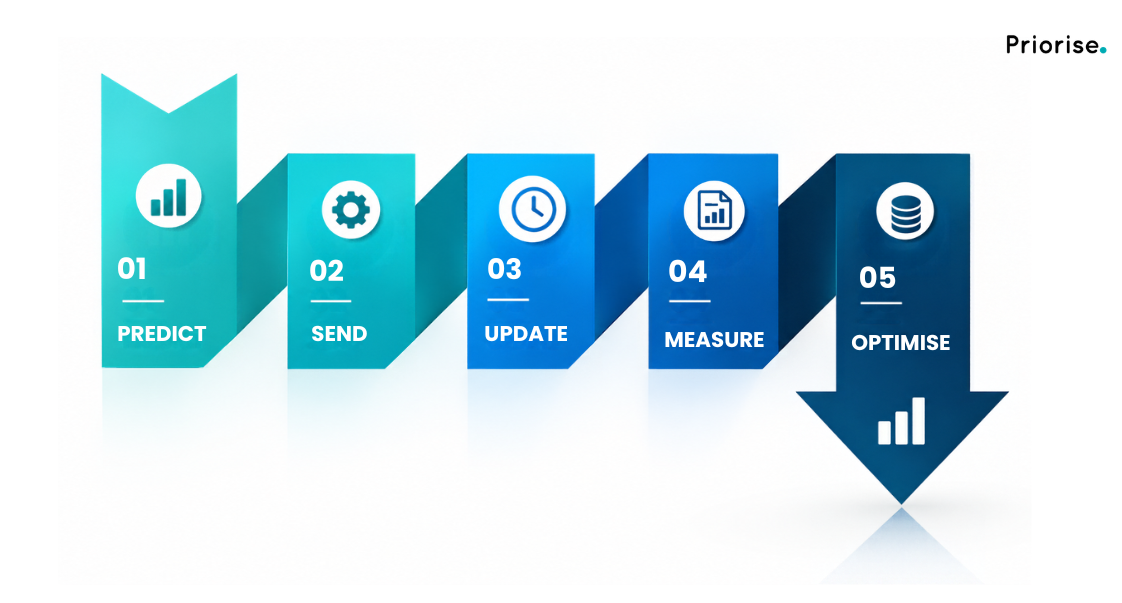
Fig 2: A loyalty analytics platform should connect prediction to action, measurement, and optimisation
Who Owns the Metric Definitions?
Active member, lapsed, and redemption rate can mean different things to marketing, finance, and the vendor’s default template. If the platform hard-codes its own versions, your board pack and your dashboard can start to disagree.
Ask whether you can define each metric once, version it, and see which reports use which version. The same governance question matters when comparing customer loyalty analytics across teams: everyone needs to know exactly what sits behind the number.
At Priorise, we work through these questions in roughly this order: identity, grain, measurement, activation, definitions. The first two answers determine how far the other three can go.

Evaluating a loyalty analytics platform?
We can test vendor answers against your own data before you sign
FAQs
Not on its own. Ask for results on your own data and evidence that the model can support meaningful incremental measurement against an appropriate control or holdout group.
Yes. Scope it around one defined business question and a measurable outcome, rather than using the pilot as a tour of features. Where appropriate, include a holdout so you can test incremental impact.
Not always, but you need reliable transaction history at a level of detail that supports your intended use cases, with a clear owner for data quality.
Long enough to cover several purchase cycles and, where relevant, a seasonal peak. That may mean weeks for groceries and months for lower-frequency categories.
Yes. Finance can validate points liability, category margin, and the financial definition of ROI. A platform that is blind to those inputs can overstate the value of a campaign or recommendation
Sources
McKinsey & Company, “Members only: Delivering greater value through loyalty and pricing”, April 2024. McKinsey & Company source

Bhawana Khater Dalmia
Co-founder/Director
Bhawana Khater Dalmia is Co-founder and Director at Priorise, with over 15 years of experience in consulting, strategic planning, and growth. She has co-founded three businesses spanning consumer goods, growth marketing and decision science, and advises leadership teams on using data and analytics to drive measurable commercial outcomes. She writes on data strategy, revenue growth, retail analytics, customer loyalty, sales enablement and the role of data and AI in driving better commercial decisions.
Bhawana Khater Dalmia is Co-founder and Director at Priorise, with over 15 years of experience in consulting, strategic planning, and growth. She has co-founded three businesses spanning consumer goods, growth marketing and decision science, and advises leadership teams on using data and analytics to drive measurable commercial outcomes. She writes on data strategy, revenue growth, retail analytics, customer loyalty, sales enablement and the role of data and AI in driving better commercial decisions.
You might also Like
