
A loyalty programme does two things at once, and your reporting cannot tell them apart. It changes what some customers buy. It also collects points on purchases that were always going to happen. Both arrive as member transactions, and both land in the same revenue line.
Pulling those apart is the whole job of loyalty programme ROI measurement, and it is where many retail teams stall. Not because the maths is difficult, but because the honest answer depends on a counterfactual: what that member would have done if they had never joined.
Start with the comparison almost every loyalty deck opens on. Members spend more than non-members; therefore, the programme works.
Think about who joins. People sign up when they already shop with you often enough for rewards to feel worth collecting. Your heaviest customers join first; your occasional customers join late or never. So the member group was richer than the non-member group before the programme touched either of them.
Compare the two, and you measure that head start. Then you label it programme impact.
This is why finance teams push back on loyalty decks, and they are right to. The gap is real. The attribution is not. Match members to comparable non-members on prior spend and tenure, and the lift shrinks, sometimes sharply. The programme may still create value. It creates less than the raw number suggested, and that difference can determine whether the budget still looks defensible.
Most reporting mixes five different questions into one dashboard and treats them as equally meaningful. They are not. They stack.
| Rung | What it tells you | What it does not |
|---|---|---|
| Enrolment | Who signed up | Whether anything changed |
| Engagement | Who opened, scanned or redeemed | Whether they bought differently |
| Behaviour | What members do now versus before | Whether the programme caused it |
| Incrementality | What changed because of the programme | What it cost to cause |
| ROI | What it earned after its own cost | Nothing further, if the rungs below are sound |
Here, loyalty means economically meaningful changes in customer behaviour, such as greater frequency, broader category participation or stronger retention. Programme engagement alone is not proof of loyalty.
Many teams report the top two rungs and treat them as evidence of programme performance. That is the gap. Everything below incrementality is activity, and activity is the thing you control rather than the thing you achieved.
The lower rungs are not useless. Enrolment and engagement tell you the programme is functioning. They cannot tell you it is working, and those two get confused constantly.
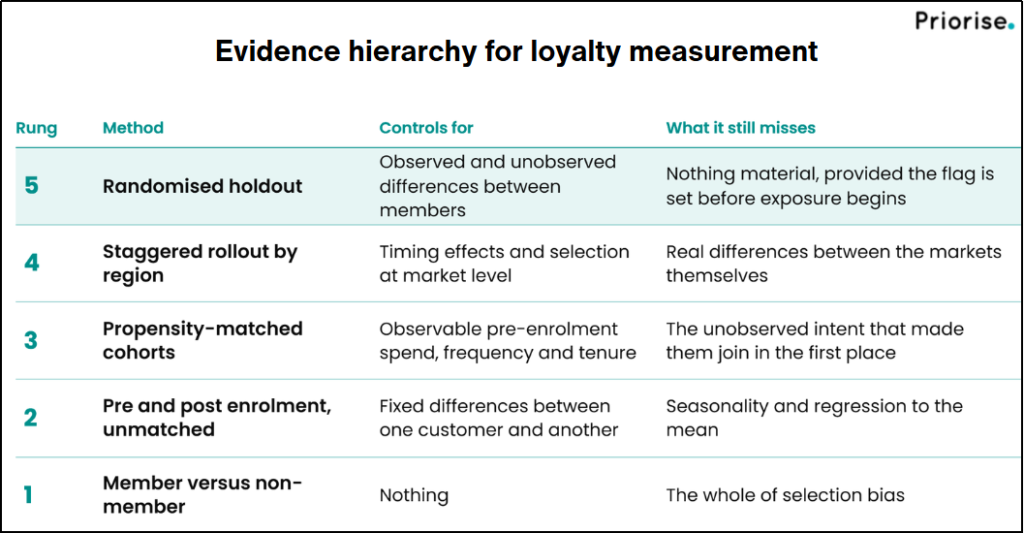
Fig 1: Five ways to measure what your customer loyalty program changed [Priorise]
Customers who join loyalty programmes are already your better customers. They shop more, spend more, and were doing both before they filled in the form. Compare their spend with non-members, and you measure that pre-existing difference, then label it programme impact.
That is why finance teams push back on loyalty decks, and they have a point. The gap can be real, but attribution is not automatic.
Anyone who has run a matched-cohort analysis knows how deflating this gets. Match members to comparable non-members on prior spend and tenure, and the headline lift can shrink. The programme may still create value, just less than the raw comparison suggested, and that difference can decide whether the budget survives.
That creates a simple hierarchy for loyalty measurement. Enrolment tells you who joined. Engagement tells you who used the programme. Behavioural metrics tell you what changed. Incrementality tells you what changed because of the programme. ROI only becomes meaningful once that last question is answered.
Run all four. Any one of them on its own leaves an obvious counter-argument open.
| Question | What to measure | Signals real loyalty | Signals subsidised transactions |
|---|---|---|---|
| Did behaviour change after joining? | Spend, frequency and category breadth before and after enrolment, matched cohorts | Frequency and breadth both rise and hold past two quarters | Spend rises for one cycle, then settles back to baseline |
| Would this have happened anyway? | Loyalty programme incrementality against a randomised holdout or matched control | Lift persists once you strip out matched controls | Most of the gap disappears after matching |
| Which stage are we actually moving? | Outcomes split across pre-purchase, purchase and post-purchase | The effect shows up at the stage you designed for | The only movement is at the till |
| Does it survive margin? | Incremental margin after redemption costs, funded discounts and reward costs | Positive incremental margin across a full evaluation window | Positive on revenue, negative once redemption cost lands |
That fourth row catches more programmes than people expect.
The cleanest answer to customer retention versus transactions comes from a holdout. Withhold the offer from a small randomised slice of eligible members, leave them alone for a defined period, and measure the difference.
Marketing will not want to withhold rewards from paying customers, and operations will not want the exception logic. But for a programme spending millions every year, the cost of a controlled holdout can be small compared with the cost of defending an ROI number you cannot prove.
If a full holdout will not clear internally, you still have options, and they rank in a clear order rather than sitting as equivalents. Stagger the rollout by region and treat later markets as your control. Use propensity matching on pre-enrolment behaviour. Compare cohorts by enrolment month against seasonality-adjusted baselines. None matches a randomised holdout for causal confidence, so state that limitation clearly rather than let someone else find it.
Most programmes treat enrolment as a free upside. An inactive member may cost little on their own, so more members can look like a straightforward win. That holds only if members are the only people affected.
Members get visible benefits. Non-members watch that happen. If those benefits appear undeserved, some non-members may pull back.
Research published in the Journal of Service Research in 2025, tested this across two firms. The researchers found that enrolling new members can increase profits. They also found that higher new-member enrolment was associated with lower spending among non-members, while new members sought more discounts than other customers. The authors link part of the non-member effect to customers perceiving member benefits as undeserved. They also found that clearer programme rules and more experienced managers can reduce some of the negative effects.
That sits neatly alongside the broader measurement problem. A new member may be valuable, but enrolment alone does not tell you whether the programme created that value or simply captured a customer who was already likely to buy.
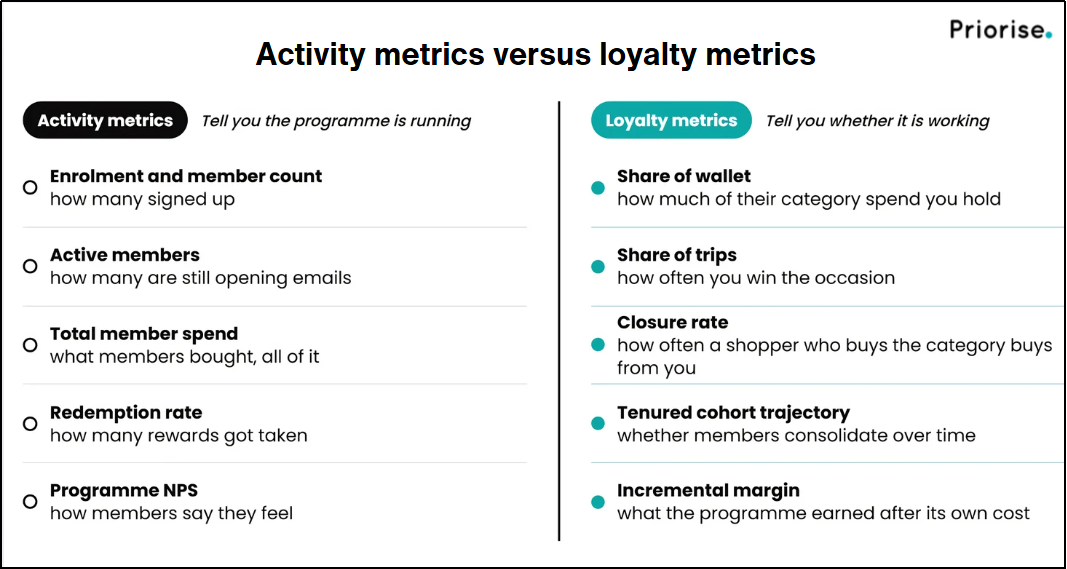
Fig 2: customer loyalty program can improve every metric on the left while losing ground on every metric on the right [Priorise]
Loyalty is not only a marketing line. It is a balance sheet item, and at scale a large one.
Under IFRS 15 and ASC 606, when loyalty points provide customers with a material right, the related promise is generally treated as a separate performance obligation. That means part of the transaction price is allocated to the points and recognised as revenue when the related obligation is satisfied, with breakage estimates affecting the timing of recognition.
Marketing owns the behaviour change. Finance owns the accounting consequences. Programmes get into trouble when the two work from different numbers.
Most diagnostics fail on plumbing, not method. Before you run any of the above, you need:
Fix the plumbing first. The modelling gets easy once the inputs behave.
Pick the largest single spend line in your customer loyalty programme, usually the base earn rate or the joining offer. Build a matched control, or preferably a randomised holdout where practical. Measure incremental margin across enough purchase cycles to see past the first reaction, not just across the promotional window. Then decide whether that spend earns its place.
You may find it does. You may find part of your reward budget subsidises behaviour you already have. Either answer sharpens the next planning cycle, and both beat running the member versus non-member slide for another year.

Priorise builds the measurement layer underneath customer loyalty programs.
You may also like: Mastering Customer Loyalty Analytics: The Complete Playbook
————————————–
Sources
Understanding Loyalty Program Effectiveness across the Customer Journey: A Meta-Analysis. Journal of Retailing (2026): https://www.sciencedirect.com/science/article/pii/S0022435926000758
IFRS Foundation, IFRS 15 Revenue from Contracts with Customers: https://www.ifrs.org/issued-standards/list-of-standards/ifrs-15-revenue-from-contracts-with-customers/
8 The Green Ste A,
Dover, DE – 19901
103-105, 1st Floor, Krishna Square, Subhash Nagar, Jaipur – 302016
+91 7300266999