


Key highlights
- Many high-impact demand events follow lunar calendars, weekday-based rules, school calendars, or other date conventions, so they can shift by days or weeks each year. A forecast that only sees week numbers can place the peak in the wrong week.
- The fix starts in the data model: an event dimension, the right data grain, and event-aligned reporting.
- Treat the event calendar as governed master data, not a planner's spreadsheet, and test forecasts on the years when events moved most.
A demand forecast can be accurate for most of the year and still fail when a major event moves by two weeks. Every demand planner knows which periods of the year matter. The trouble starts when the data model assumes those periods stay put.
Many events that drive retail and consumer demand follow lunar calendars, weekday-based rules, school calendars, or other date conventions. They can therefore land in a different week or even a different month each year. The forecast inherits whatever calendar logic sits in the underlying data. In many stacks, that logic is thinner than people assume.
For example, if an event falls in Week 42 one year and Week 44 the next, a week-based model may see unusually low demand in Week 42 and unusually high demand in Week 44. An event-aware model can instead recognise both periods as part of the same event cycle and learn the demand pattern around the event.
Demand Forecast Accuracy Starts in The Calendar Table
Most retail data platforms have a solid date dimension with day, week, month, and fiscal period. Few have an event dimension that records which event applies, in which market, and how many days away it is. Without one, the model can rely heavily on week numbers and last year’s same-week sales.
| Where the event lives in the data | What the model learns | What happens when the date moves |
|---|---|---|
| Week or month columns only | The peak recurs in a fixed slot | The forecast peaks in the wrong week |
| Same-week-last-year lag | The prior year's week is treated as a useful analogue | A shifted event can move the comparable demand pattern into another week |
| Event flag on the day itself | Demand spikes on the event day | It misses the build-up and the post-event dip |
| Event dimension with days-to-event | Demand responds relative to the event | The pattern holds when the date shifts |
The model still matters, but better event features can matter more than simply switching algorithms. Gradient boosting, Prophet, and regression-based time series models can all handle a moving event when the features describe it. For example, a days-to-event feature can tell the model that demand may begin rising 14 days before an event, peak shortly before it, and fall afterwards.
The point is not that model choice is unimportant. It is that even a strong forecasting algorithm struggles when the underlying data does not tell it when and where an event occurs.
Data Grain Decides What the Model Can See
Monthly data blurs event timing. An event near a month boundary splits its build-up across two months, and the split changes every year. The model can then read a timing shift as a change in volume.
The same principle appears in official statistical guidance: higher-frequency observations can provide more precise estimates of calendar effects when the underlying data supports that frequency. Eurostat’s1 guidance on seasonal adjustment notes that calendar effects estimated from quarterly data are less precise than those estimated from monthly data and recommends using the highest frequency that still provides reliable estimates.
For many demand forecasting applications, that makes weekly or daily data preferable when the underlying demand is frequent and sufficiently stable. At SKU and location level, that can preserve the timing of an event that disappears in a monthly national or global roll-up.
Location grain matters as much as time grain. Many events only move demand in certain markets or regions. A forecast built on a national or global aggregate can average those effects away, so the event dimension needs a market key, not just a date.
Time grain is only one part of the problem. The transaction point matters too.
Shipments can lead to consumer demand. Distributors and retailers may stock up ahead of an event, so sell-in can peak earlier than sell-out and fall more sharply afterwards. A model trained only on shipment data may therefore learn pipeline filling rather than consumer buying. Where the forecasting objective is consumer demand and reliable sell-out or point-of-sale data exists, it is generally more informative than shipments alone; where it does not, shift the event windows earlier and expect a post-event trough in shipments.
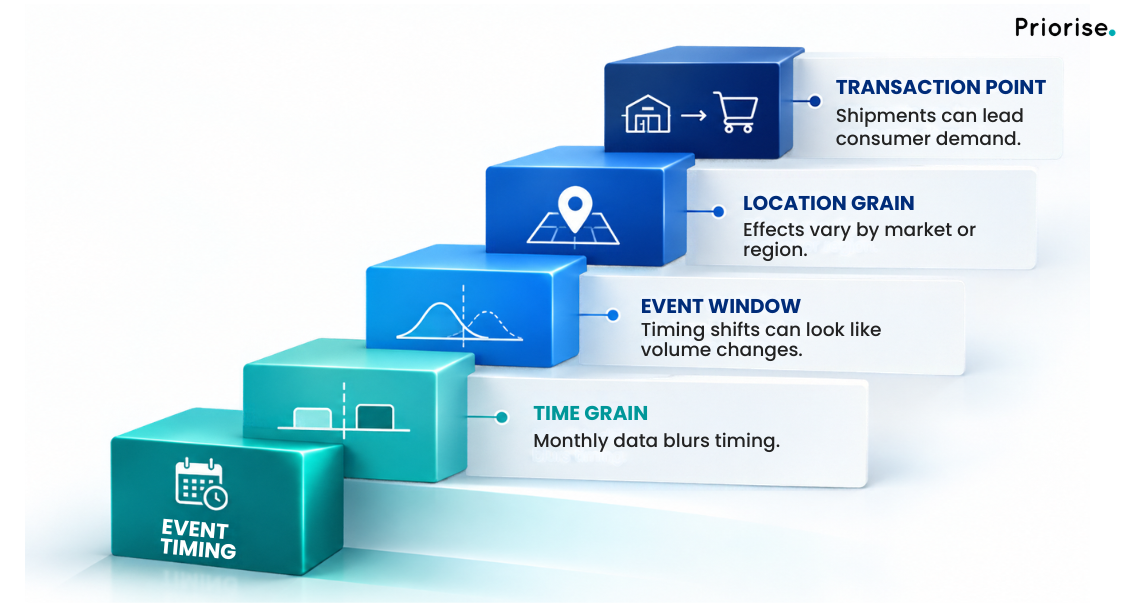
Fig 1: Calendar effects in forecasting can directly impact demand forecast accuracy
Calendar-based reporting gives false signals
The forecast error is only half the damage. A dashboard that compares this month with the same month last year will show a sharp decline whenever an event has moved into the following month. The next month can then show growth that is not real either.
Teams that act on both signals may cut replenishment on the false dip and chase stock on the false surge.
The answer sits in the semantic layer. Build event-aligned views that compare the same number of days before and after each event across years, and keep them next to the calendar views. Finance will still need calendar periods for reporting, so do not replace them. Label both views clearly so nobody reads one as the other.
These calendar effects in forecasting become especially visible when an event moves across reporting periods. An event-aligned view separates the timing shift from the underlying demand change.
Treat the Event Calendar as Master Data
In many businesses, the event calendar lives in a planner’s spreadsheet. It gets updated late, differs by team, and has no history. That is a data-formation problem more than a modelling one.
The event calendar is part of the core demand planning data. A usable version needs:
- Future dates loaded well ahead of the planning horizon
- Market-level entries rather than one global list
- Versioning, so backtests use the calendar as it stood at the time
- Event types and planned promotions recorded alongside them, so overlaps show up in the data before they show up in sales.
Versioning matters because the calendar used to evaluate a forecast should reflect what was actually known at the time. If an event date is corrected later and the revised calendar is used for an old backtest, historical forecast performance can be distorted.
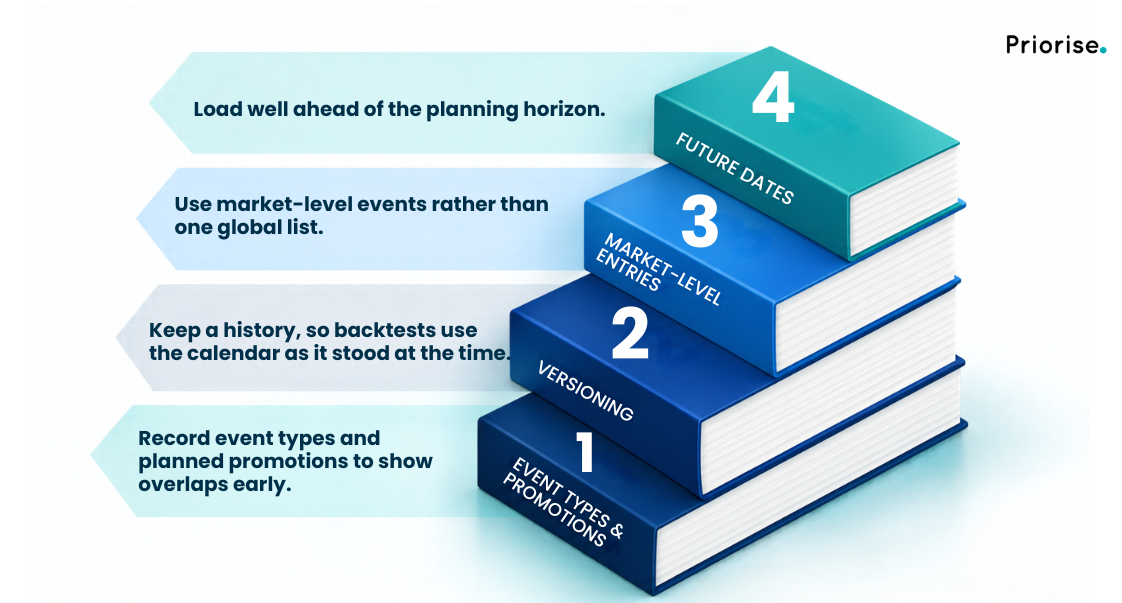
Fig 2 Build reliable demand planning data by treating your event calendar as structured master data
Testing forecasts against moving events
Full-year accuracy hides event misses. A forecast can miss an event fortnight badly and still post a respectable annual percentage error because the rest of the year dilutes the error.
Run three checks instead.
- Backtest on the years when key events moved furthest against the prior year, not only on the most recent year.
- Measure error and bias inside each event window separately, and track the direction of the miss. A forecast that is consistently early is a different operational problem from one that is simply noisy. An early miss can increase carrying costs and markdowns. A late miss can create lost sales at the peak.
- Check SKU-level demand forecasting accuracy at market or store-cluster level wherever events vary by region.
When two events overlap in a way history rarely shows, the model has little to learn from. Plan those periods as scenarios with a named owner rather than trusting the statistical average.
At Priorise, our Demand Sense work starts with the event calendar and data grain before model selection, because event-period accuracy depends on whether the underlying data captures when and where demand patterns actually shift.
Does your forecast know where the next event falls?
Talk to us about event-aware, SKU-level demand forecasting

FAQs
The event may have moved relative to the calendar while the model continues to treat the same week as the comparable period. Without event-aware features, it can place the demand peak too early or too late.
Usually not. Adding an event dimension and days-to-event features typically requires retraining and validation rather than rebuilding the entire forecasting system.
Only roughly, because monthly data blurs timing. Move to weekly or daily grain where the source systems support it, and the demand pattern justifies the additional detail.
Treat it as governed master data with one owner, market-level entries, and version history.
Calendar-month comparisons can mix timing shifts with real demand changes, so add event-aligned views alongside standard calendar reporting.
Sources
Eurostat, ESS Guidelines on Seasonal Adjustment – https://ec.europa.eu/eurostat/web/products-manuals-and-guidelines/w/ks-gq-24-012

Bhawana Khater Dalmia is Co-founder and Director at Priorise, with over 15 years of experience in consulting, strategic planning, and growth. She has co-founded three businesses spanning consumer goods, growth marketing and decision science, and advises leadership teams on using data and analytics to drive measurable commercial outcomes. She writes on data strategy, revenue growth, retail analytics, customer loyalty, sales enablement and the role of data and AI in driving better commercial decisions.
