


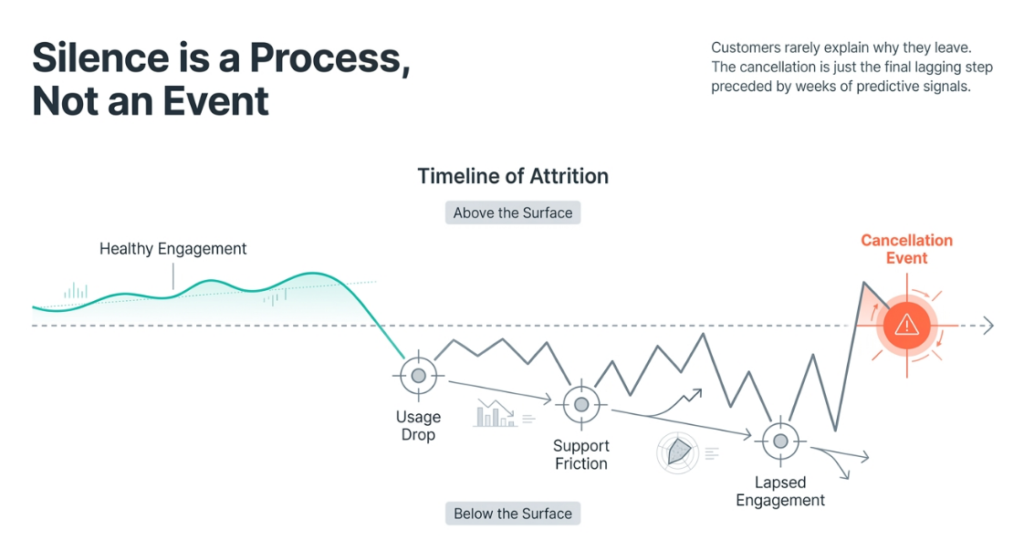
When was the last time a customer told you exactly why they left? Not the auto-generated cancellation reason from a dropdown menu, but the real reason. For most businesses, the honest answer is: rarely, if ever. Customers don’t explain themselves. They just disengage, and silence is usually the only warning you get.
This blog covers what customer churn analysis actually means, the real reasons people walk away, and a clear process for spotting it early enough to do something about it.
What Is Customer Churn Analysis?
Customer churn analysis is the practice of examining customer data to understand attrition: who stopped buying, cancelled, or went inactive, and what behaviors led up to that point. It’s not a single metric or a one-time report. It’s an ongoing process of collecting data, identifying who has churned, grouping them by shared characteristics, and tracing the patterns back to a cause. The goal isn’t just to measure how many people left, but to understand the mechanism behind the loss well enough to interrupt it for the next customer heading down the same path.
Churn generally falls into two buckets:
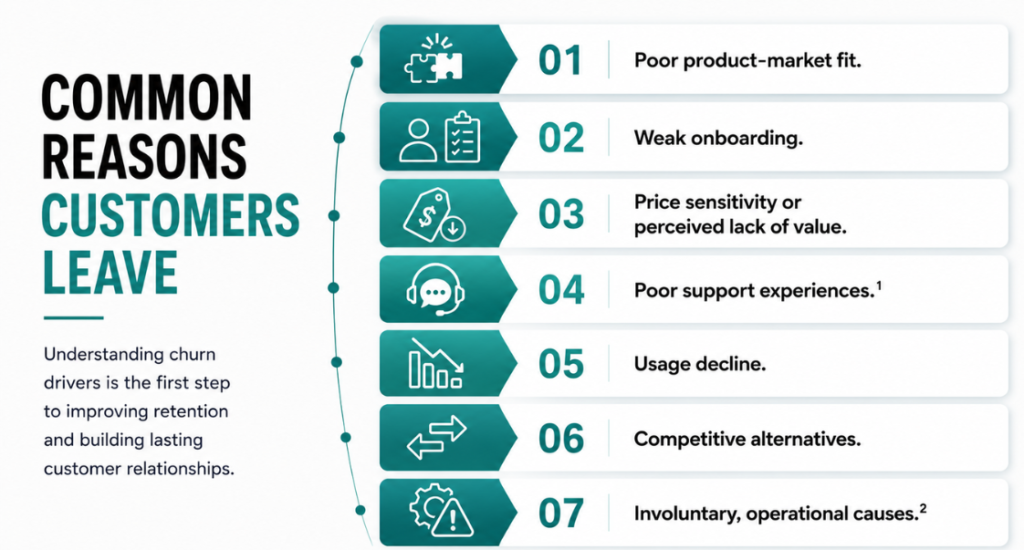
- Voluntary churn: the customer actively chooses to leave, usually because of a bad experience, a better offer elsewhere, or the product no longer fits their needs.
- Involuntary churn: the customer didn’t intend to leave at all. Expired cards, failed payments, or a renewal that silently lapsed are common culprits, especially for subscription businesses.
Getting churn analysis right also sets the stage for customer churn prediction: using the patterns uncovered in past data to identify, in real time, which current customers are showing the same early signs of leaving.
Why Identifying the Reasons Behind Churn Matters
It would be easier to just track a churn percentage and move on. But a number without a reason attached doesn’t tell you what to do next, and customer churn prediction only works once you know what signals precede a loss. Here’s why digging into the “why” pays off.
1. It protects the revenue you’ve already earned. Every churned customer creates a two-part cost for the revenue that disappears, and the acquisition spend required to replace it. Most businesses track the first number and underestimate the second.
2.It catches problems before they scale. Churn is rarely random. If one segment is leaving for the same reason, that reason will likely affect the next cohort too unless it’s addressed.
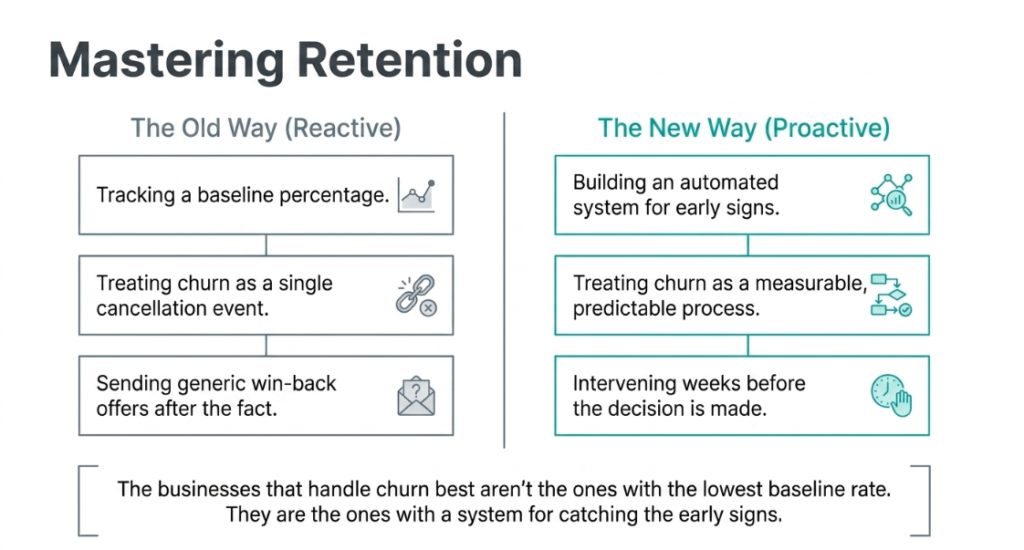
3.It sharpens where you focus retention efforts. Not all customers churn for the same reason. Knowing the actual driver lets teams design interventions that match the real problem instead of sending generic win-back offers.
4.It reveals weak points in the customer journey. Churn often clusters around specific moments: right after onboarding, around a renewal date, or after a support interaction. Mapping where it concentrates shows exactly which part of the journey needs attention.
5.It makes forecasting more reliable. Understanding the signals that precede churn lets you build more accurate revenue predictions, rather than relying on historical averages.
Key Metrics to Track in Customer Churn Analysis
Effective customer churn analysis is only as strong as the data behind it. These are the core metrics worth tracking consistently.
| Metric | What It Measures | Why It Matters |
|---|---|---|
| Churn Rate | Percentage of customers lost over a period | Establishes the baseline churn level, especially across cohorts |
| Customer Lifetime Value (CLTV) | Expected revenue from a customer relationship | Declining CLTV can signal retention issues |
| Retention Rate | Percentage of customers who remain active | Tracks long-term customer loyalty |
| Repeat Purchase / Usage Rate | Frequency of repeat purchases or usage | Often indicates churn risk before it occurs |
| Time-to-Churn | Average time before customers leave | Helps time retention interventions effectively |
| Net Promoter Score (NPS) | Customer willingness to recommend | Adds sentiment context to behavioral data |
| Customer Acquisition Cost (CAC) | Cost of acquiring a new customer | Shows whether retention supports acquisition spend |
Churn rate tells you something happened. CLTV and repeat usage tell you it was coming. Time-to-churn tells you when to step in.
The Step-by-Step Process for Identifying Why Customers Leave
This is the part that turns churn analysis from a vague idea into a repeatable workflow.
Step 1: Define what “churn” means for your business. For subscription businesses, this is usually cancellation or non-renewal. For ecommerce or usage-based products, it’s often an inactivity window: 60, 90, or 120 days, depending on buying cycles. Without a shared definition, teams calculate churn differently, and the numbers stop being comparable. This definition also becomes the label your churn prediction model is trained to predict get it wrong, and the model learns the wrong thing.
Step 2: Collect and unify customer data. Churn signals are usually scattered: transactions in one system, support tickets in another, usage data in a third. Pull together purchase history, product usage, support records, billing status, and marketing engagement for effective analysis.
Step 3: Identify who has already churned. Using your definition, pull the list of customers who’ve crossed that threshold, then look backward at their behavior: did usage decline gradually or drop suddenly? Was there a support interaction right before they left?
Step 4: Segment churned customers into meaningful groups. Lumping everyone together hides the story. A core part of good customer churn analysis is segmenting by acquisition channel, plan tier, usage pattern, or tenure. Patterns invisible in an aggregate number often become obvious once you split the group.
Step 5: Visualize the patterns. Plotting churn by cohort or lifecycle stage makes patterns visible: a drop-off after month one, a spike after a price change, a decline tied to an underused feature. This is usually where the real insights surface, and where customer churn prediction starts becoming practical rather than theoretical.
Step 6: Run root-cause analysis. Keep asking why until you reach an actionable cause. Cross-reference support tickets, NPS responses, and usage data from churned customers to triangulate the real driver, rather than guessing. This is also where customer churn prediction begins to take shape: the behavioral patterns you identify here often become the features a churn prediction model is trained on, the model then learns statistically which combinations of those signals actually precede churn.
Step 7: Build and test retention interventions. Design a response that targets the cause directly: a guided first week for weak onboarding, clearer value communication for pricing concerns. Test on at-risk customers, measure impact, then roll out. This is what separates churn analysis from churn reporting. It only pays off once it changes what your team does. Businesses that consistently reduce customer churn treat retention as an ongoing system, not a one-time fix.
Summary
Churn isn’t a single event. It’s the end of a process that usually starts weeks earlier with small, visible signals. Customer churn analysis means defining churn clearly, unifying your data, segmenting churned customers, and tracing patterns back to a root cause, turning a vague attrition number into something you can act on. Customer churn prediction takes this further, using those same patterns to flag at-risk customers before they actually leave. The businesses that handle churn well aren’t the ones with the lowest baseline rate. They’re the ones with a system for catching the early signs before it’s too late to respond.
How Priorise Helps You Identify and Reduce Churn
Spotting churn early means having your customer signals (usage, support, billing, engagement) in one place instead of scattered across five tools. Priorise brings that data together, flags at-risk customers based on real behavioral patterns, and helps your team prioritize the interventions most likely to save the account, turning customer churn prediction into a proactive habit rather than a reaction to a cancellation that’s already happened. Don’t wait for the cancellation email. Connect with Priorise today and turn your customer data into your strongest retention tool.
FAQs on Churn Analysis
What’s the difference between churn analysis and churn rate?
Churn rate is a single number: the percentage of customers lost in a period. Customer churn analysis is the broader process of understanding why that number is what it is, and customer churn prediction takes it further by flagging who is likely to leave next.
What is a “good” churn rate?
It depends heavily on industry and business model. Track your own trend over time and compare it against your specific category rather than a generic target.
How often should customer churn analysis be done?
Ideally on a recurring basis, monthly or quarterly, rather than as a one-off project, since patterns shift as your customer base and product evolve.
Can churn be predicted before it happens?
Yes. Customer churn prediction works by tracking declining usage, lapsed engagement, or support friction, all of which typically appear weeks before a customer formally churns.
Should involuntary churn be treated separately from voluntary churn?
Yes. Involuntary churn is largely an operational fix, while voluntary churn requires addressing product or experience gaps. Mixing the two blurs the real cause
Sources:
¹Qualtrics reports that 72% of people switch to a competitor after just one negative interaction, making poor support one of the most common and most fixable churn triggers.
² Recurly’s 2026 State of Subscriptions data shows Failed payments account for an estimated 20–40% of subscription churn.