


Key highlights
- Most enablement ROI figures compare reps who opted in against reps who did not, so they measure who joined the programme as much as what the programme did.
- A twelve-month before-and-after window usually contains several other commercial changes, and the gap it produces belongs to all of them.
- A defensible enablement attribution model fixes three things before rollout: the comparison group, the metric, and a measurement window sized to the sales cycle.
Every enablement leader walks into the quarterly review with a number. Ramp down from ten weeks to six. Win rates up nine points among reps who finished the new discovery programme. Content engagement up across the target account list. The numbers are usually accurate. The trouble starts when they have to carry an ROI claim.
A figure becomes evidence only when it survives one question: what would have happened without the programme? Most enablement measurement never gets that far. It compares completers against non-completers, or this quarter against last, and treats the difference as impact. But that gap contains more than the programme effect. It also contains every other factor that changed at the same time.
There is a useful distinction here between attribution and incrementality. Attribution asks what touched the outcome. Incrementality asks what changed because of the intervention. A content asset can influence a deal without creating additional revenue. For an ROI decision, the second question matters more.
The First Attribution Problem Starts With Who Signs Up
Think about who actually completes an optional certification, adopts a new call framework, or regularly uses the content library.
They are the reps with bandwidth. Reps have bandwidth when their pipeline is healthy. They are the reps whose managers push adoption, and those managers coach harder on everything else too. They are often the reps sitting on stronger territories, because a rep chasing a shortfall in a thin patch spends the hour dialling instead of learning.
The completer group and the non-completer group therefore differ before the programme even starts. Compare their outcomes afterwards, and the gap reflects motivation, manager quality, territory potential, deal mix and potentially the training itself. The problem is not that the programme had no effect. The problem is that this comparison cannot tell you how much effect it had.
Mandatory rollouts remove the opt-in problem but create a different measurement challenge. Everyone gets the programme, so there is no untreated comparison group. The remaining benchmark is usually the past, which brings its own contamination.
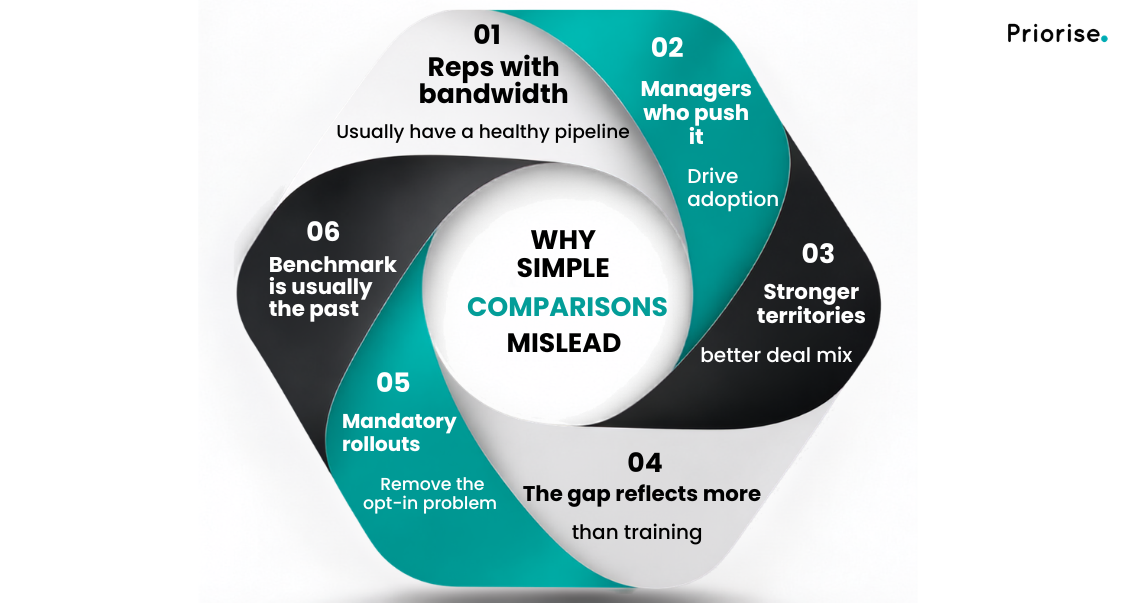
Fig 1: Better enablement ROI starts with separating what changed from what simply happened
Your Before-And-After Window Is Not Clean
Sales organisations do not hold still for a year while enablement runs an experiment. Comp plans change. Territories get carved. Pricing moves. A product ships. Two managers leave.
Gartner’s August–September 2025 survey of 227 chief sales officers found that sales organisations completed an average of four transformations in the preceding 12 months. That makes a year-long before-and-after comparison particularly difficult to interpret: an enablement programme is unlikely to be the only material change affecting seller performance during that period. The four-transformation figure is an indicator of organisational change, not a count of confounding factors in any individual company.
Two more effects sit in the same window. Seasonality distorts any comparison that does not cover a full annual cycle. Regression to the mean creates another trap. Enablement programmes are often targeted at teams that are already underperforming. Some of that poor performance may improve naturally over time, even without the intervention, making the programme appear more effective than it was.
Here is what the common reported figures actually contain.
| What gets reported | What the figure holds | What turns it into evidence |
|---|---|---|
| Win rate lift among trained reps | Motivation, manager quality, territory strength, plus some training effect | A comparison group matched on pre-period attainment and territory |
| Ramp time reduction | Hiring quality and market conditions in that intake cohort | Two or more intake cohorts, one enabled, one on the old path |
| Enablement-influenced revenue | Deals where an enablement asset or activity was recorded as a touch, including deals already in motion | An incrementality test using a credible comparison group |
| Content engagement linked to pipeline | Reps with healthy pipelines have time to browse content | Randomised access, or a staggered release by team |
The enablement-influenced revenue row deserves a flag. Touch-based attribution counts a deal as influenced when a rep opens collateral, attends a session, or records another qualifying interaction. As the definition of “influenced” expands, coverage can move closer to the entire book of business. That makes the metric useful for understanding reach, but much less useful for estimating incremental revenue. Finance does not need to reject the metric entirely. It needs to know what question the metric can actually answer.
What a Defensible Enablement Attribution Model Looks Like
None of this necessarily requires a dedicated research team. It requires the measurement decisions to be made before rollout rather than after the results are already on the slide. The goal is not methodological sophistication for its own sake. It is enough evidence to decide whether a programme should be scaled, redesigned or stopped.
- Hold a group back: When reps share accounts, managers or coaching environments, randomising at team level can reduce spillover that would otherwise contaminate a rep-level comparison. The right unit of randomisation depends on how the intervention is actually delivered.
- Stagger the rollout when a pure holdout is politically impossible: Region A in Q1, Region B in Q2, Region C in Q3. Each wave acts as a control for the wave ahead of it, and everybody gets the programme eventually.
- Match on pre-period behaviour when neither option survives the room: Pair each participant with a non-participant on prior quota attainment, tenure, segment, territory potential, and manager. Matching is weaker than randomising, and it only balances the variables you thought to include.
- Run difference-in-differences, and test the assumption behind it: Compare the groups' performance trends before the programme begins. If those trends were already moving apart, the method cannot reliably attribute the later gap to the intervention.
- Write the metric down before launch: Pre-declaring the primary measure, the window, and the success threshold stops the quiet hunt for the metric that happened to move.
- Check the statistical power honestly: A 40-rep team with a long sales cycle may not have enough statistical power to detect a two-point win-rate change against normal quarter-to-quarter variation. That limitation belongs in the planning discussion, not buried in the results readout.
Pipeline hygiene decides whether any of this works. Stage definitions that drift between teams, opportunity records updated in batches at quarter end, and inconsistent close-reason coding can undermine a causal analysis before selection bias gets a chance to. The broader lesson is that measurement depends on data being structured for decision-making, not simply stored for reporting.
Sizing the Measurement Window
A useful measurement window should account for the ramp period for the behaviour you changed, enough sales cycles to observe the outcome, relevant seasonality, and any retention or expansion effect you plan to claim.
That produces very different answers by motion. A transactional SMB team with a thirty-day cycle can read a result inside a quarter. An enterprise motion with a nine-month cycle and annual budget seasonality may, in some cases, require something closer to 18–24 months to produce a clean revenue read, depending on the outcome being measured.
Sometimes the honest answer is that the result will not land inside the current fiscal year. Publishing an eight-week readout on a nine-month sales cycle can tell you something about leading indicators such as pipeline creation, but it cannot credibly represent the full revenue impact. Label the result for what it actually measures.
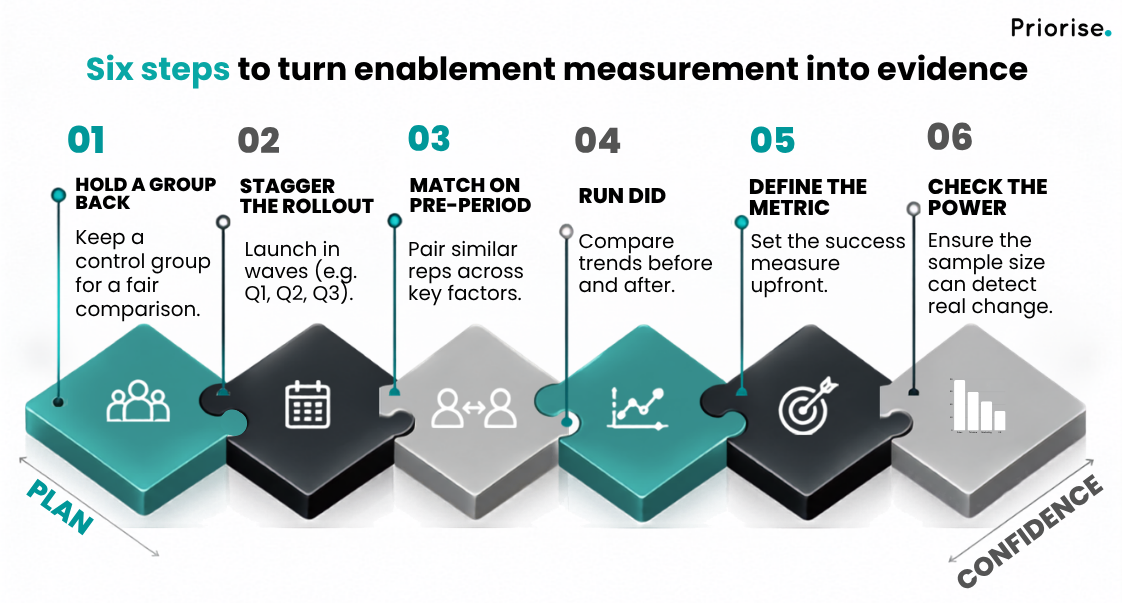
Fig 2: A defensible sales enablement ROI starts with better measurement
AI Makes Attribution Easier. Proving Impact Harder.
AI-assisted enablement adds another layer to the measurement problem. When recommendations, coaching prompts, content, and next-best actions are delivered directly inside the seller workflow, more activity becomes traceable to the enablement system. That can make influence easier to record without making incremental impact easier to prove.
The same principle applies: a logged interaction is not evidence of causation. If an AI recommendation appears on a deal that was already highly likely to close, recording the interaction does not make the resulting revenue incremental. The measurement question remains the same: what would have happened without the intervention?
What CFO Enablement ROI Conversations Actually Need
Finance is not asking for a bigger number. Finance is asking three questions, and the sequence matters.
What is the counterfactual? Name the comparison group and how it was formed. How confident are you? Give a range with the reasoning behind it. A defensible range with a stated method survives scrutiny better than a single point estimate nobody can reproduce. What went into the cost base? Platform licenses, content production, seller hours out of the field, and manager coaching time all belong in the denominator. Where material, the opportunity cost of taking sellers away from active selling should be considered too.
Answer those three, and the conversation changes shape. Proving enablement revenue impact stops being an annual defence of the function and becomes a repeatable test for deciding which programmes to scale, redesign or stop.
Ultimately, the output is not an ROI percentage. It is a better investment decision. Leadership needs to know whether to scale the programme, redesign it, fund it differently or stop it.
This is the measurement layer. Priorise helps revenue teams build a credible comparison design, the pipeline data foundations underneath it, and a causal read that can stand up to finance review.
Ready to make your enablement ROI defensible?
Design an enablement attribution model today

FAQs
Decide the rule before launch, keep them in the analysis as originally assigned, and report attrition separately so the result stays honest.
Yes, as a coverage or reach metric. It can show where enablement activity is present in the sales process. But it should not be treated as incremental revenue unless the measurement design can show what changed because of the intervention.
Measure leading behaviours across more observations, such as call quality, opportunity progression or multithreading, and report them honestly as behaviour change rather than incremental revenue.
You cannot cleanly separate the effects if both changes affect the same group at the same time. Sequence the changes, use different comparison groups where feasible, or accept that the quarter will not produce a clean causal read.
Sources
Gartner, “Gartner Predicts AI-Driven Sales Enablement Will Deliver 40% Faster Sales Stage Velocity Than Traditional Enablement Methods by 2029”, 1 April 2026. https://www.gartner.com/en/newsroom/press-releases/2026-04-01-gartner-predicts-ai-driven-sales-enablement-will-deliver-40-percent-faster-sales-stage-velocity-than-traditional-enablement-methods-by-20291

Bhawana Khater
Co-founder/Director
Bhawana Khater Dalmia is Co-founder and Director at Priorise, with over 15 years of experience in consulting, strategic planning, and growth. She has co-founded three businesses spanning consumer goods, growth marketing and decision science, and advises leadership teams on using data and analytics to drive measurable commercial outcomes. She writes on data strategy, revenue growth, retail analytics, customer loyalty, sales enablement and the role of data and AI in driving better commercial decisions.
Bhawana Khater Dalmia is Co-founder and Director at Priorise, with over 15 years of experience in consulting, strategic planning, and growth. She has co-founded three businesses spanning consumer goods, growth marketing and decision science, and advises leadership teams on using data and analytics to drive measurable commercial outcomes. She writes on data strategy, revenue growth, retail analytics, customer loyalty, sales enablement and the role of data and AI in driving better commercial decisions.